Data Preparation and Visualization in Python
 Created with AI (Bing Image Creator)
Abstract
This class focuses on the techniques and tools required for data preparation and data visualization in python. Specifically, it will cover the usage of libraries such as numpy, pandas, matplotlib, seaborn, and plotly, which are essential for handling data manipulation and visualization tasks in various domains. The class aims to equip learners with the fundamental skills and knowledge needed to work with data effectively and efficiently.
Data Preparation
Data preparation is a critical step in the data analysis process, involving the transformation of raw data into a format that can be analyzed by data scientists or machine learning algorithms. The primary steps involved in data preparation include:
- Data Cleaning
- Data Integration
- Data Transformation
- Data Reduction
- Data Discretization
However, it’s important to note that the specific steps and order in which they are performed may differ depending on the data set and analysis goals.
Data preparation is a big part of the whole Data Science process. According to CrowdFlower report in 2016, it is seen that out of 80 data scientist, they will spend their day in the following: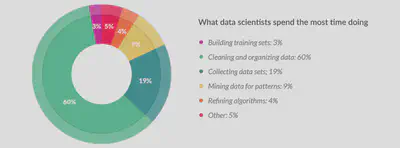
Let’s take the example of music streaming platform, SoundCloud, and explore how each of these steps could be applied to their data.
Data Cleaning
SoundCloud has access to vast amounts of data from its users, but this data can contain duplicate, corrupt, inaccurate, or irrelevant information. The platform must handle such data to ensure accuracy and avoid analytical errors. Some challenges that SoundCloud might face during data cleaning are:
Incomplete or inconsistent user information: SoundCloud may have difficulty analyzing its users’ music preferences if there is missing or inaccurate account information, such as age, gender, or location. For example, if SoundCloud wants to analyze the most popular songs among its young users in the United States, incomplete or inconsistent user information could lead to inaccurate results.
Songs with incomplete metadata: : Sound metadata includes information like artist name, album, release date, etc. Any inconsistencies or inaccuracies in metadata can affect various analysis tasks, like analyzing top albums or artists. For example, if a song is mislabeled with an incorrect artist name, it could lead to inaccurate analysis of an artist’s popularity.
Inconsistent Artist Names: There may be different variations of artists’ names on SoundCloud, like incorrectly spelled names, abbreviated names, or stage names that can lead to inconsistent track listings. Inconsistent artist names can lead to misrepresentation of an artist’s most popular tracks or top plays. For example, using different spellings of an artist name like “Nick Cave” as “Nic Cave” or “Nicholas Edward Cave” will make the total number of plays for each track under her name dispersed inaccurately.
Data Integration
SoundCloud may have data from multiple sources such as user profiles, song playlists, album data, and song metadata. All these data sources can be integrated to create a comprehensive dataset. This data integration can help in exploring correlations between songs, user preferences, and identifying popular artists, genres, and playlists.
Data Transformation
The data needs to be transformed into a usable format for analysis. For example, SoundCloud may group users by location, age, or behavior to create new variables or features. They may also perform feature engineering to create new variables. For example, SoundCloud might transform user data into a score indicating how active and engaged each user is on the platform, based on metrics such as likes, comments, and track reposts.
This step might also include Normalization, which scales data to a specific range to eliminate the effects of the scale of the feature on the analysis.
Data Reduction
Organizations may choose to focus on a subset of the data for analysis, such as popular songs or active users. For example, SoundCloud may only consider songs with more than 1,000 plays, or users who have listened to more than 10 songs in the past week.
Data Discretization
Continuous data may be discretized to create categories or groups for analysis. For example, Soundcloud may group users by age ranges (e.g. 18-24, 25-34, etc.) or create a new variable to indicate the popularity of a song (e.g. unpopular, popular, very popular).
NumPy and Pandas
So now that we have a better understanding of the data preparation process, let’s learn how to process data efficiently using the numpy and pandas libraries.

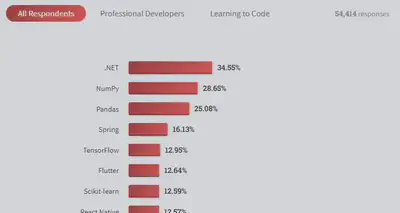
A survey conducted by Stack Overflow in 2022 shows that numpy and pandas are the second and third most popular libraries in different domains.
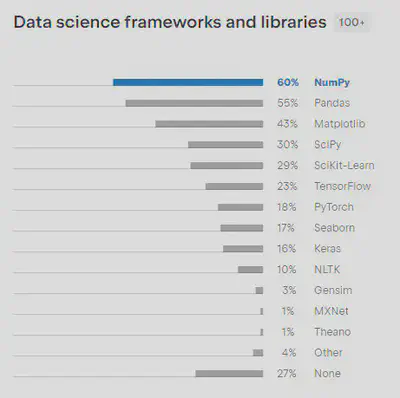
Also, according to the 2021 JetBrains Developer Survey, numpy and pandas are the most popular libraries in data science frameworks.
Now let’s learn everything we need to know about these two libraries!
- Slide 1: Introduction to NumPy
- Exercise 1: Analyzing Job Offers (Initial | Solution)
- Slide 2: Introduction to Pandas
- Exercise 2: Analyzing IMDB Top 250 Movies (Initial | Solution)
Data Visualization
Data visualization is the process of creating graphical representations of data to communicate information effectively. It is an essential tool for data analysts as it enables them to explore and analyze large datasets quickly and easily, providing insights that may not be immediately apparent from a table of numbers.
The need for data visualization arises because humans are visual creatures and we process information more efficiently when it is presented in a visual format. A well-designed graph or chart can tell a story, highlight trends and patterns, and reveal relationships in the data that might be missed when analyzing raw data.
Matplotlib, Seaborn, and Plotly
Now that we understand the importance of data visualization let’s dive into the world of Python visualization libraries such as matplotlib, seaborn, and plotly, and explore the unique features of each library.
- Notebook: Data Visualization in Python
Sources and Useful Links
📖 Books
- “Python Data Science: The Ultimate Guide on What You Need to Know to Work with Data Using Python”, by Oliver Soranson
- “Python for Data Analysis: Data Wrangling with Pandas, NumPy, and IPython”, by Wes McKinney
- “Storytelling with Data: A Data Visualization Guide for Business Professionals”, by Cole Nussbaumer Knaflic
🎞️ Videos
- “Data Analytics With Python” by Simplilearn
- “NumPy Tutorial : Numpy Full Course” by Derek Banas
- “Matplotlib Tutorial (Part 1): Creating and Customizing Our First Plots” by Corey Schafer
- “Matplotlib Tutorial : Matplotlib Full Course” by Derek Banas
- “Exploratory Data Analysis with Pandas Python 2023” by Rob Mulla
📚 Documentation
- NumPy Documentation
- Pandas Documentation
- Matplotlib Documentation
- Seaborn Documentation
- Plotly Documentation
🌐 Survey and Reports
Parsa Abbasi
MSc Student
He is an AI graduate student with a keen interest in graph neural networks, relational graphs, natural language processing, and deep learning.